

How long is long term?
We need to look at investments over many decades to see past all the ups and downs, say Elroy Dimson, Paul Marsh and Mike Staunton


As John Maynard Keynes famously remarked almost a century ago, “in the long run we are all dead.” Of course, he was right. And it underpinned his justification for active intervention in the economy. He went on: “Economists set themselves too easy, too useless a task, if in tempestuous seasons they can only tell us, that when the storm is long past, the ocean is flat again.”
But in capital markets, the very term “long term” raises an interesting question: what do we mean by it? On railway station billboards and in glossy magazines, advertisements for unit trusts point out in the smallest of small print that the value of investments may fall as well as rise. True enough. But over what period? When personal finance writers in newspapers suggest that investors who put their money into equities should be prepared to hold on for at least five years, is that right? Is half a decade really long term?
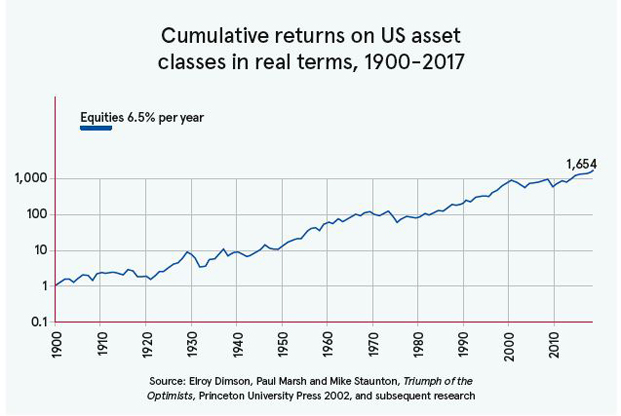
Our research into investment returns has allowed us to adopt a perspective that few would deny is truly long term: it goes back to the beginning of the 20th century – more than the lifetime of anyone still alive today. And over that period, stock market investment has been hugely profitable. In cash terms, an investment of just one dollar in the US stock market would have grown to $47,661 by the end of 2017. Even after taking inflation into account, an investment would have increased 1,654-fold – a real gain averaging 6.5 per cent a year. For the United Kingdom, the average annual return was 5.5 per cent. (These figures are for total return: they assume that dividends are reinvested.)
But of course, these results conceal some severe setbacks. Look at the US experience: in the depths of the Wall Street crash, equities had fallen by 80% in real terms. Many investors were ruined – particularly those who bought stock with borrowed money. The crash lived on in the memories of investors – and, indeed, those who subsequently shunned equities – for at least a generation. But as the graph shows, equities eventually recovered and scaled new heights. There were other dips: in the wake of the OPEC oil shock in the 1970s, for example; the bursting of the technology bubble in 2000; and the financial crisis of 2007-9.
Certainly, we must acknowledge that there are and were stock markets outside the US. Since 1900, the US has done better than most (although it has not been the best performer: the top spot goes to South Africa). Nevertheless, every single one of the 21 markets covered by our research back to 1900 generated a positive real return – typically averaging between three and six per cent a year.
So, the picture is clear: over the very long term – more than a century – equities have proved to be an excellent investment.
But again, this tells us little about what an individual investor – someone who has been advised to think in terms of a time-frame as short as perhaps five years – should expect.
Look at what has happened since the turn of the millennium. The 21st century began with one of the most savage bear markets in history. The downturn started in early 2000 and, by March 2003, US stocks had fallen by fully 45 per cent. In Britain, the picture was even worse: equity prices halved. And Germany suffered a fall of two thirds.
But thereafter, markets staged a remarkable recovery: gains reduced the bear market losses and some countries eliminated them completely.
World markets hit new highs at the end of 2007. But then came the global financial crisis. Share prices slumped, bottoming out in March 2009 before staging yet another strong recovery. Yet it took 13 years – until 2013 – for many of the world’s largest markets to regain the levels seen at the start of 2000.
This teaches us a lesson worth dwelling upon and gives some perspective on what we might consider to be “long term”. Many investors would consider 13 years to be comfortably within long-term territory. But as recent experience shows, it is insufficient a period over which to rely upon investments in equities to deliver the sort of annual returns seen over the past century or so.
Since the post-crisis trough, share prices have recovered, with relatively few setbacks along the way. Volatility has been low. But we can be confident that volatility will re-emerge at some stage and markets will again fall sharply. We just cannot know when.
The volatility of markets means that, even over periods as long as 20 years, we can still experience “unusual” returns – returns that are far adrift from truly long-term averages.
Consider, for example, an investor at the start of 2000 who looked back over the previous 20 years, regarding this as “long-term” history, and hence providing an indication of what to expect in the future. At that point, the turn of the millennium, the historic real annualised return on global equities over the previous 20 years had been 10.6 per cent. That seemed encouraging enough – and, after all, 20 years sounds like a pretty long-term perspective to take.
But what happened over the following decade? Our investor endured two sharp downturns. The net effect was that, over the 10 years from 2000, he or she would have earned a negative real return on world stocks of minus 1.3 per cent a year. This was a brutal reminder that the very nature of the risk for which the investor sought a reward – the risk of holding equities rather than bonds or cash – means that results can be poor, even over many years.
The lesson is clear. The returns for the two decades from 1980 to 2000 suggested too rosy a picture for the future. The Eighties and Nineties were a golden age. Inflation tumbled from the highs seen in the Seventies and early Eighties and that in turn lowered interest rates and bond yields. Profi t growth accelerated. World trade and economic growth both expanded. These factors led to strong performance by both equities and bonds. However, by definition, golden ages occur only infrequently. The returns that investors saw in the last two decades of the 20th century were atypical. To make useful inferences about returns on equities, we need to look at very long time periods.
Our 118 year returns include several golden ages, as well as many bear markets. There were periods of great prosperity as well as recessions; financial crises and the Great Depression; periods of peace and episodes of war.
A very long perspective is required in order to balance out the bad luck with the good. Only then can we secure a real understanding of what the long run can tell us about the future.
As shown above, over the long term the very long term – equities have delivered strong returns. But it is worth considering where these returns have come from. Day-to-day, investors tend to focus on share prices: has the market price of a share in company A gone up or down? They look at the capital gain (or loss) on their investment. Indeed, over a year, equities are so volatile that most of the performance of a portfolio will be attributable to capital gains or losses. Dividend income adds a fairly modest amount to each year’s capital gain or loss.
But long-run returns are heavily influenced by reinvested dividends. Indeed, over long periods, dividends account for the large majority of investors’ total returns.
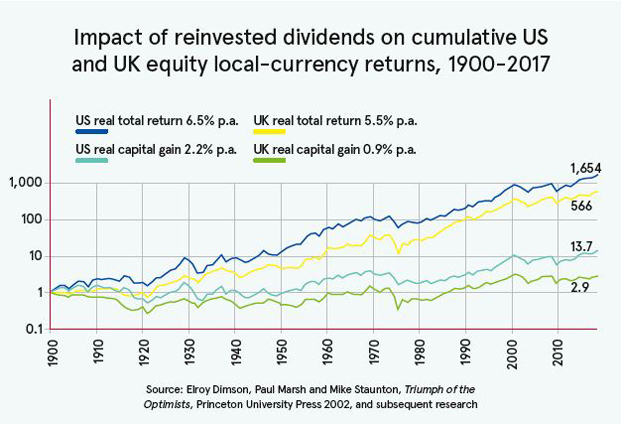
Graph 2 shows the effect of reinvesting dividends. The blue line shows the total real return on investing one dollar in US equities at the start of 1900 and reinvesting all the dividend income. Come 2018, the initial investment would have grown in purchasing power by 1,654 times.
On the same graph, the turquoise line shows the real return obtained by a US index fund that paid out all its income, rather than investing dividends. It plots capital gains in real terms – after taking inflation into account. The initial investment of one dollar in 1900 would have grown in purchasing power by 13.7 times by the start of 2018. That’s equivalent to an average real capital gain of 2.2 per cent a year. Put another way, a portfolio of US equities with dividends reinvested would have grown to 120 times the value it would have attained if dividends had been spent.
The picture for the UK shows an even more dramatic contrast. Over the 118 years, an index fund with dividends reinvested would have grown to 195 times the value it would have attained if dividends had been spent along the way: real capital gains were just 0.9 per cent a year.
All of which is to take a very long-term view. But it’s only the truly long term that gives us a well-founded view of investment returns – even if, after many years, it may be future generations who benefit from our long-term thinking.